Protecting Solar Energy Assets From Hazardous Weather

Hailstorm warning system combines weather sensors & nowcasts.
By Johan Jacques, Meteorological Consultant
Republished courtesy of KISTERS North America, Inc.
According to the U.S. Energy Information Administration, between 2020 and 2035 solar power is estimated to rise from 3% to 14% of total energy production in the United States. By the year 2050, this particular renewable energy source may account for 20%.
Concurrent with this optimistic clean energy outlook is the likelihood that precipitation events become more extreme, based on the extensively peer-reviewed Assessment Report 6 (AR6) from the Intergovernmental Panel on Climate Change (IPCC).
Protecting photovoltaic panels against hazardous weather like extreme winds and hail events will be significant to the availability and reliability of solar power.
Limited occurrence period, Significant costs
Especially large hailstones can damage solar panels, externally and internally (microcracks), leading to sub-optimal performance of the power output efficiency. In the long run, panel functionality may further deteriorate as dust or water penetrates these cracks.
In the Northern Hemisphere, the period of occurrence is mainly limited to April through September. Some areas are more prone to hailstorms than others. However, many areas in the U.S. with the largest potential to produce solar energy are the same areas most at risk for hail events.
Fig. 1 The U.S. NWS Storm Prediction Center map shows Texas, Oklahoma, Kansas, and Nebraska most at risk, with some parts facing hail events with hailstone sizes > 2 inches with a frequency more than one day per year .
” data-image-caption=”
NOAA
” data-medium-file=”https://cleantechnica.com/files/2022/06/2-Inch_Hail-400×296.png” data-large-file=”https://cleantechnica.com/files/2022/06/2-Inch_Hail-800×592.png” loading=”lazy” class=”wp-image-269518 size-full” src=”https://cleantechnica.com/files/2022/06/2-Inch_Hail.png” alt width=”1273″ height=”942″ srcset=”https://cleantechnica.com/files/2022/06/2-Inch_Hail.png 1273w, https://cleantechnica.com/files/2022/06/2-Inch_Hail-400×296.png 400w, https://cleantechnica.com/files/2022/06/2-Inch_Hail-800×592.png 800w, https://cleantechnica.com/files/2022/06/2-Inch_Hail-768×568.png 768w” sizes=”(max-width: 1273px) 100vw, 1273px”>
Figure 1. The U.S. NWS Storm Prediction Center map shows Texas, Oklahoma, Kansas, and Nebraska most at risk, with some parts facing hail events with hailstone sizes > 2 inches with a frequency more than one day per year. Image courtesy of NOAA.
As large hail events remain rare, the damage they cause can be very significant. Due to a combination of a historical correction and recent cases in Texas, solar insurance prices are soaring — rising as much as 400% over the last few years — to a $1 million deductible and 15% physical damage limit.
Previously, insurance policies with a minimum $100,000 deductible or 5% of the physical damage limit were common. Today, a $250,000 deductible and 5% limit aren’t uncommon.
Maximum physical damage limits are becoming more frequently defined in polices instead of full physical damage coverage.
Seeking cost controls, utilities are turning to weather data to protect their assets. The delivery of actionable information is providing more awareness of potential hail damage and lead time to prepare.
What would you do with up to 3 days’ notice?
With a forecast timeframe of up to 3 days, operators and field crew teams can monitor and prepare assets for the risks.
The use of numerical weather prediction (NWP) models in addition to several model parameters, instability indices and simulated radar reflectivity can give indirect hints about the occurrence of hail. Several good models are available in the public domain and commercial.
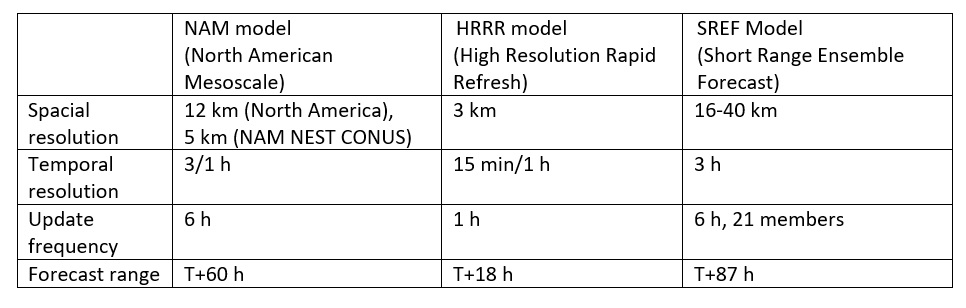
Table 1. Freely available statistical models that help determine hailstorm occurrence, (freely available statistical models that help determine hailstorm occurrence, source Johan Jacques, KISTERS AG).
Besides the classical model parameters, the High Resolution Rapid Refresh (HRRR) model also produces an interesting parameter called GRMAX01, which provides one-hour forecasts of maximum last hour hail/graupel diameter at the surface.
The above proposed models NAM and HRRR are deterministic, while SREF provides ensemble data that can be used to derive the probability of severe weather events. Note: parameters like instability / hail (especially for HRRR outputs) are considered experimental.
What would you do with up to 2 hours’ notice?
With 0-2 hours lead up, protective measures may move solar panels into a safe position, lowering the damage resulting from large hailstones. Besides the above-mentioned NWPs, nowcasts — short range forecasts using observed radar and advanced extrapolation algorithms — based on polarimetric X-band type radar installations may support decisions.
X-band radars typically have a useable radius of 30-60 km (19-37 mi). Beside the classical parameters like reflectivity and precipitation intensity, the radars provide reliable information about the precipitation type reaching the surface, including summer hail.
X-band radars also have the advantage of high resolution and high update frequency.
By combining the precipitation type with nowcasting techniques, and applying alerting thresholds to these data, a hailstorm early warning system can be established to mitigate damage and increase system resilience.
Fig. 2. Example of precipitation type from X-band radar, set at a 125-m resolution. Red pixels show areas with large hail occurrences. (Screen capture of precipitation radar data from X-band radar, set at 125 meter resolution. Red pixels reveals areas with large hail occurrences.
” data-image-caption data-medium-file=”https://cleantechnica.com/files/2022/06/Picture2-1-400×197.jpg” data-large-file=”https://cleantechnica.com/files/2022/06/Picture2-1.jpg” loading=”lazy” class=”wp-image-269517 size-full” src=”https://cleantechnica.com/files/2022/06/Picture2-1.jpg” alt width=”605″ height=”298″ srcset=”https://cleantechnica.com/files/2022/06/Picture2-1.jpg 605w, https://cleantechnica.com/files/2022/06/Picture2-1-400×197.jpg 400w” sizes=”(max-width: 605px) 100vw, 605px”>
Figure 2. Example of precipitation type from X-band radar, set at a 125-m resolution. Red pixels show areas with large hail occurrences. (Screen capture of precipitation radar data from X-band radar, set at 125 meter resolution. Red pixels reveals areas with large hail occurrences.| Image source Johan Jacques, KISTERS AG.)
Lessons to be learned from every event
After a storm has occurred, the ability to prove that large hail fell at the utility site is becoming crucial. Some parametric insurance based on agreed thresholds is emerging. For example, a policyholder may need to document the occurrence of hail stones greater than 2 in. in diameter.
Besides evidence from X-band radars, onsite hail sensors are essential. At the minimum they should provide good statistics about the distribution of sizing of hailstone in time and the number of impacts per hail size class per event.
While hail events remain rare, the exponential growth of data from a utility’s own weather sensor network, forecasting centers, and X-band radar providers establishes a need for a reliable platform to view this information, set alarms on conditions, and store for post-event analyses.
KISTERS datasphere not only integrates an organization’s own monitoring network data with forecasts and nowcasts from external sources, but Hyquest Solutions America, a KISTERS group company also provides end-to-end hail sensors and nowcast technology.
As a career meteorologist, Johan Jacques leads the conceptual development of the high-resolution precipitation information service HydroMaster. Closely working with water companies, energy utilities, and network operators allows Johan to directly address the needs and frustrations identified by today’s water professionals who require innovative decision support tools. Johan also provides training and technical support to both HydroMaster and datasphere customers and partners.
Appreciate CleanTechnica’s originality and cleantech news coverage? Consider becoming a CleanTechnica Member, Supporter, Technician, or Ambassador — or a patron on Patreon.
Advertisement
This post has been syndicated from a third-party source. View the original article here.


