Hilcorp Energy, Exxon Mobil and ConocoPhillips release the most greenhouse gasses among U.S. oil and gas companies
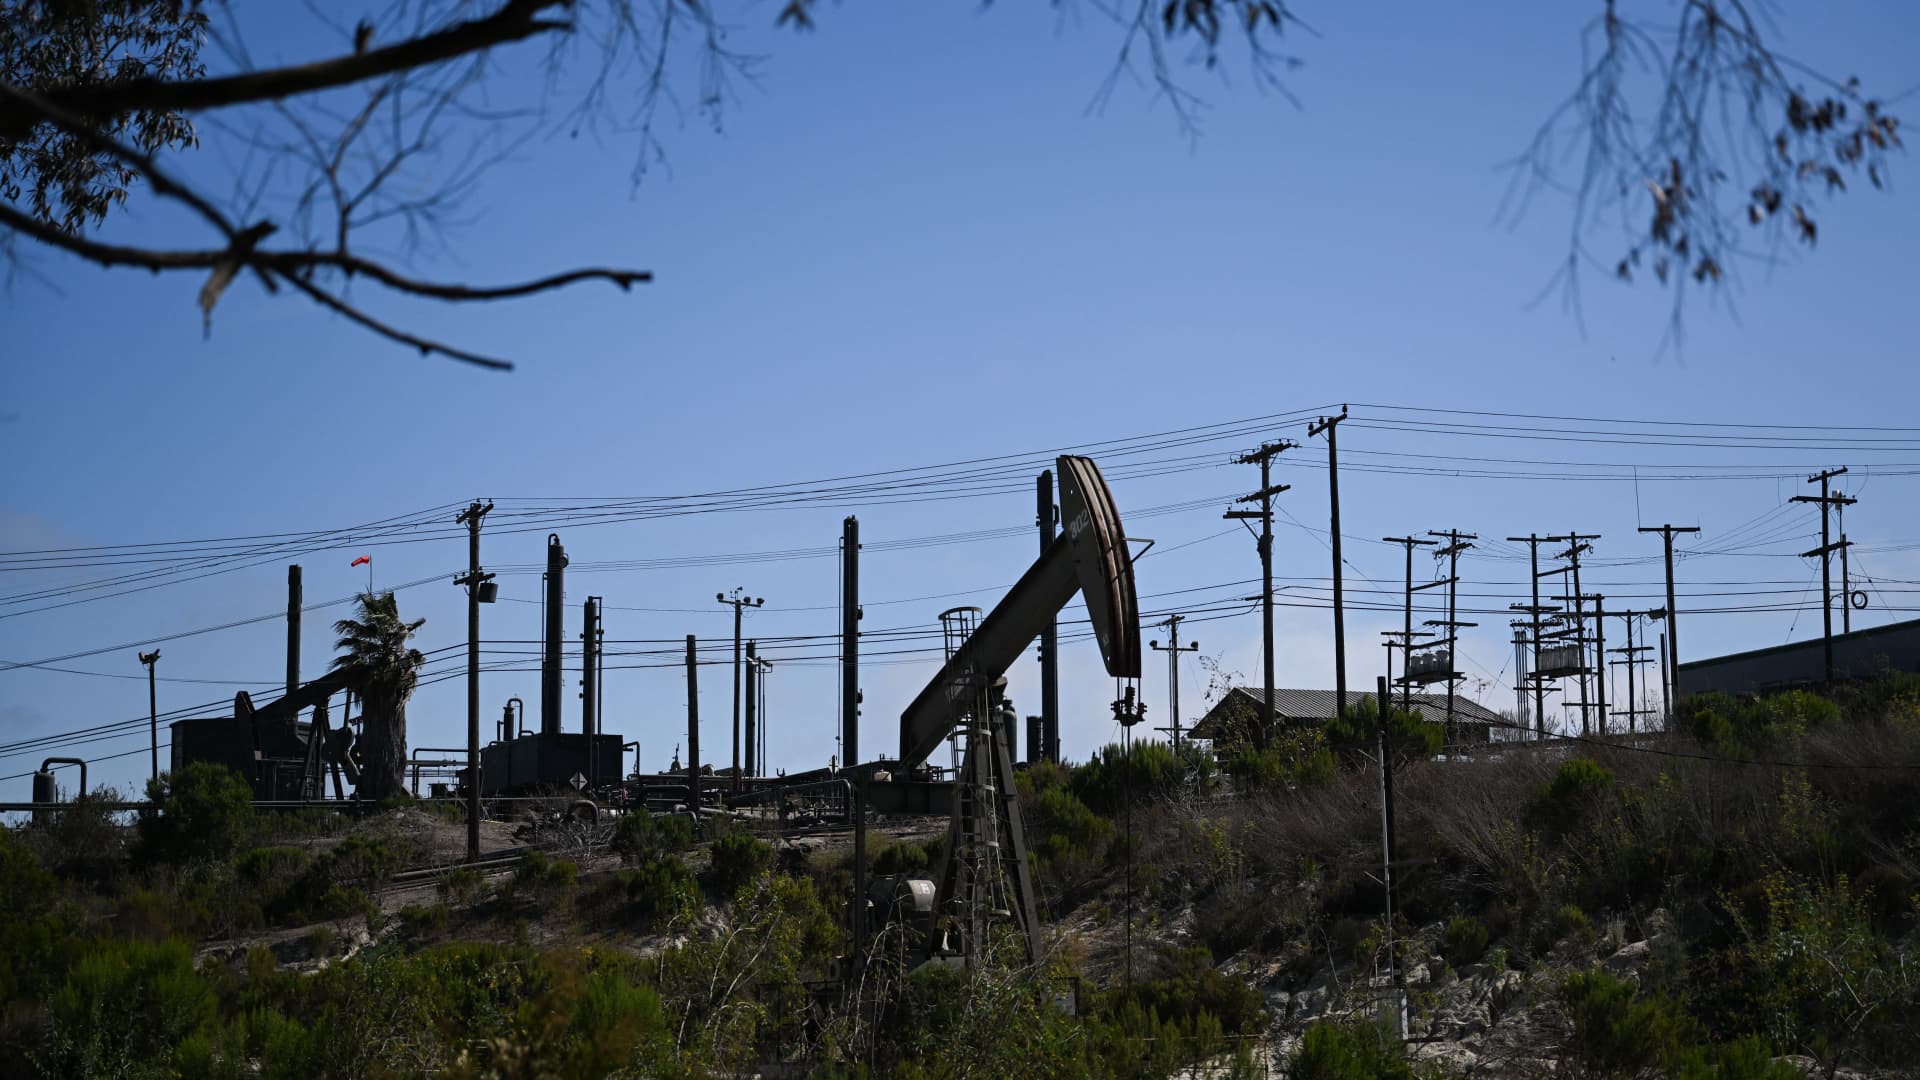
Hilcorp Energy, Exxon Mobil, and ConocoPhillips release the most greenhouse gasses among U.S. oil and gas companies, according to a new report published Thursday from several sustainability organizations using data from the U.S. government.
The annual report ranks emissions data from the 303 oil and gas companies in the U.S. that report emissions under the EPA’s Greenhouse Gas Reporting Program, and aims to bring transparency into emissions reporting, which has historically been hard to measure in a comparable and consistent manner.
Nonprofit organizations Clean Air Task Force and Ceres commissioned the sustainability consultancy ERM to develop the report, and it uses government data up through 2020, the most up-to-date emissions data available from the Environmental Protection Agency. Data for 2021 will be released in October.
Greenhouse gas emissions include methane, carbon dioxide and nitrous oxide emissions, which differ in their impact on warming. For example, over 100 years, one ton of methane emissions has the same impact on global warming as 29.8 tons of carbon dioxide. In many places, the report ranks companies and regions by so-called “GWP’s,” or units of global warming potential, which take into account these variabilities.
The total units of GWPs do not correlate directly with the production of oil and gas. For example, while Hilcorp Energy is the largest emitter of greenhouse gas units, it is the seventh-largest producer of hydrocarbons. ConocoPhillips is the third-largest emitter of greenhouse gasses and the eighth-largest producer of hydrocarbons.
“This new report makes clear what experts have long known: There are clear steps oil and gas producers can take to reduce their methane and other greenhouse gas emissions,” Lesley Feldman, senior analyst at Clean Air Task Force, said in a written statement released alongside the new report. “Some are taking those steps while others are not, and federal and state regulations are key to ensuring we can standardize best practices across the industry.”
Emissions intensity vs. total emissions
To get a sense of company’s operational abilities to decarbonize, the report measures emissions intensity, or emissions per unit of energy generated. Total emissions will tend to skew towards the largest producers, while emissions intensity does not.
In terms of total greenhouse gas emissions intensity for the 303 companies, Hilcorp Energy ranks 128th, ConocoPhillips ranks 191th and Exxon ranks 238th.
There’s a stark divergence between the companies with the highest and lowest emissions intensity. For instance, the emission intensity of natural gas producers in the top quarter of methane emitters is almost 24 times higher than the natural gas producers that fall in the lowest quarter, the report finds.
“Oil and gas producers are not equals when it comes to methane emissions, and this research makes quite clear that a company’s climate impact is a direct result of operational decisions within its control,” said Andrew Logan, senior director of oil and gas at Ceres, in a written statement released alongside the report. “The companies that are most able to effectively minimize their own emissions will be best prepared for a future zero-emissions economy.”
Oil and gas industry trade group the American Petroleum Institute (API) says the companies it represents, including both Exxon and Conoco Phillips, are working to reduce methane emissions and that it has seen a drop in average methane emissions intensity by almost 60% in seven of the major production regions (listed here).
“Our industry is at the forefront of data collection and advancing and utilizing cutting-edge technologies, including remote monitoring with satellites and lasers, to detect and reduce methane emissions and any suggestion to the contrary is false,” an API spokesperson told CNBC on Thursday.
Hilcorp Energy told CNBC it has made improvements since 2020.
“The most recent data used in this year’s CERES report is from 2020 and does not reflect the continued reductions Hilcorp has made since 2020. Based on Hilcorp’s gross, operated emissions as reported to the EPA and gross, operated wellhead oil and gas production, Hilcorp’s GHG intensity decreased by approximately 37% from 2019 to 2020 with further reductions since,” spokesperson Nick Piatek told CNBC.
Also, Hilcorp said its emissions data skews higher than its production data because of the nature of its business development strategy, which focused on acquiring older companies.
“While we inherit the emission profiles of the assets we acquire, we spend substantial capital optimizing, retrofitting, and refurbishing equipment in order to drive down emissions and intensity from these acquired assets,” said the spokesperson.
Exxon told CNBC that emissions intensity is the metric it focuses on, “because it is the truest reflection of how manufacturing companies are reducing greenhouse gases associated with each unit of production,” spokesperson Casey Norton told CNBC.
Exxon has worked to “rapidly reduce methane emissions” by look for leaks and conducting repairs.
“This includes aerial flyover monitoring in addition to hand-held imaging cameras. We are also expanding our use of ground-based sensor technology for continuous methane detection and are working with Scepter Inc. to deploy advanced satellite monitoring technology,” Norton told CNBC.
ConocoPhillips also said it considers emissions intensity a more accurate measurement of its focus on decarbonization work. “Due to our company size, we rank high on the absolute emissions ranking, but intensity measures enable a better comparison between companies and better reflect operational practices,” a spokesperson told CNBC.
This post has been syndicated from a third-party source. View the original article here.